Once again another instance of wrong data on Fyers Charts.
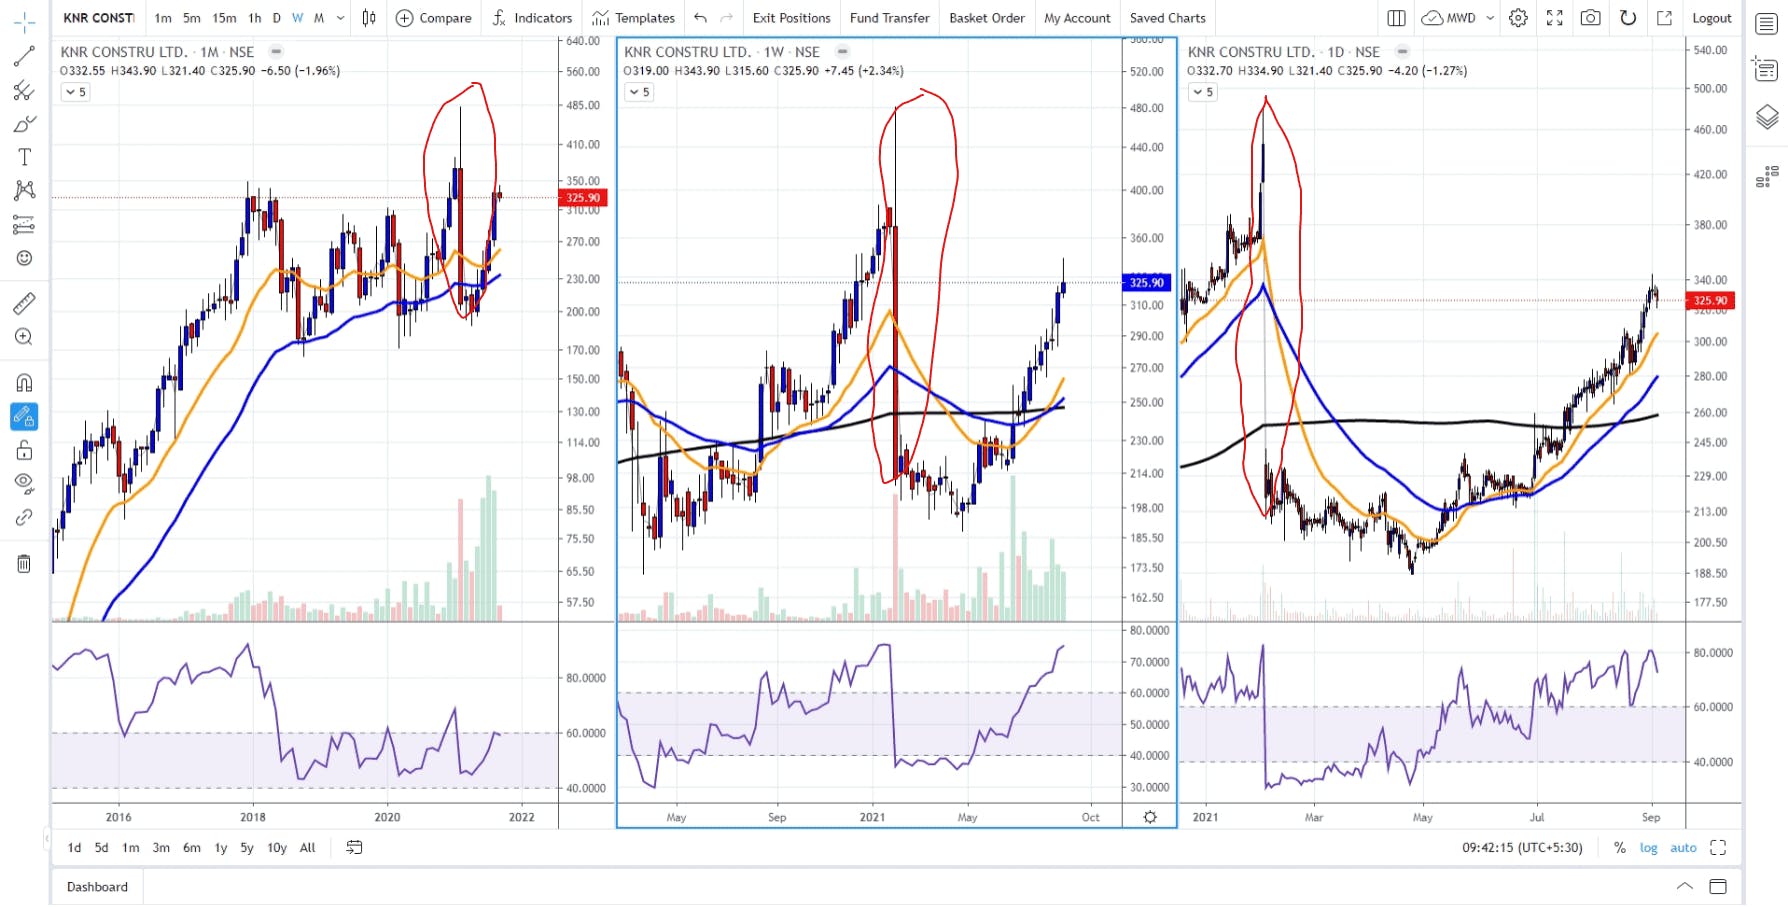
Here is the chart of KNR constructions. See the encircled portions. The stock got bonus on 3 feb 2021 but here from the charts it is appearing as if there had been a drastic fall in the stock.
How can a swing trader make a decision on the basis of faulty chart data?
I have pointed out so many issues of wrong chart data for past 2 months but it seems nothing is being done on these issues.
I'm sorry to say but there is huge unreliability issue with Fyers.