Technical charts are a graphical representation of the prices and volumes in a given period of time. It is probably the easiest way to keep track of the stock markets. Whether it is to trade, invest or simply observe, technical analysis of stocks is the most efficient way to keep yourself updated and plan your trading activities. The stock market today has been the same as it always has been. Money flows, correlations and sentiments play a significant role in short-term trading. Knowing that, it is important that you are on the right side to consistently make money in the stock market using technical analysis. On Fyers One, you use charts like a pro. Read on to know more.

“Right click” on a scrip and select “Chart”. In this example, we shall use Nifty Futures to demonstrate the available features on our trading platform. The first look of the Nifty live chart is as shown below.

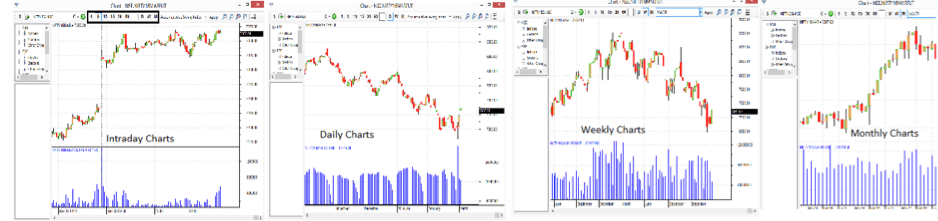
Timeframes – You can view intraday charts and end of day charts in the same window. For intraday, the available timeframes available are:
• 1 minute charts
• 5 minute charts
• 10 minute charts
• 15 minute charts
• 30 minute charts
• 60 minute charts
• Custom
The flexibility of having to choose from the variety gives you the edge to track the intraday movements in the stock market.

The end of day charts can be viewed in the following timeframes:
• Daily
• Weekly
• Monthly
The image shown above is of 4 different screenshots which shows you the different timeframes (Example: Nifty futures) namely, intraday, daily, weekly and monthly.

Zoom – You can zoom into any part of the chart of the chart to focus on the details of the price action. This feature is designed to be functionally convenient. The way to use it is:
• Zoom in – Scroll upward with the mouse or click on the ”+” icon in the highlighted region of the window as shown above.
• Zoom out – Scroll downward with the mouse or click on the “-“ icon in the highlighted region window as shown above.
• Reset Zoom – You can either click on the last icon in the highlighted region of the window as shown above. The chart will become resized according to the default settings.
• Selective Zoom – The yellow region in the live Nifty future chart shows the area which is selected. This feature allows you to select a portion of the chart and zoom into that particular area. It is very useful for intraday traders who are observing the price action very closely to improve their accuracy in technical analysis and possibly forecast the stock trends better.

For example, the image above shows you the result of what the Selective Zoom looks like. In this case it shows you the intraday chart and price action of Nifty futures. Short-term traders will especially find this feature useful. In a way, you can also practice paper trading on live charts if you’re willing to put some efforts to manually calculate your paper trading performance.

Price Info. – You can get the price information of the scrip you’re tracking by clicking on the box at the top right hand corner of the chart window. As shown in the highlighted box No.1, as you scroll along the chart, the prices will reflect accordingly. An additional way of doing it is by pressing the left button on the mouse and dragging it along the chart. A temporary box will appear that will display the price information. See Box No. 2. As you can see the prices of Nifty futures are the same in both the boxes shown above.
Information provided in this feature are:
• Opening price
• Closing price
• Day high
• Day low
• Volume
• Date and;
• Time

Technical Indicators – You can choose from over 65 indicators on Fyers One. You can load multiple indicators on the chart at the same time to analyse chart patterns and gauge the stock trends when they matter most. You can change the display size of each indicator for visual appeal too. You can apply more than 5 different technical indicators at the same time.
A mention of some popular indicators that are available are:
• MACD – Moving Average Convergence Divergence.
• RSI – Relative Strength Index
• Bollinger Bands
• Supertrend Indicator
• Parabolic SAR
• Ichimoku
• Heiken Ashi etc.

Correlation Analysis – Imagine you have a basket of 20 stocks and all of them have a high positive correlation. What happens when the stock market goes down? Everything goes down and reveals that the portfolio mix was inefficient. Correlation is very important. But so far, there was no easy way to measure performances of different stocks. On Fyers One, you can load a chart and compare its performance with any index or stock.
To use the feature, click on C and select “Indices”. You will get a popup of all the available indices on NSE. Choose any index and click on “OK”.

In the example shown above, Nifty future has been compared with Nifty IT and Nifty Energy indices. As you can see, since October last year, the energy sector has performed relatively better than IT and the overall market as you can see from the Nifty chart comparison.

To compare with different scrips (stocks/futures/options etc.), just click on “Symbol” as shown above. You will get a popup window where you can select from all the available scrips and click on “Add”.

You can select multiple stocks for a relative comparison of performance. In the example above, you can see that Nifty chart is being used for a comparison against Reliance Industries & HDFC Bank.
As you can see, HDFC Bank has outperformed Nifty in the given timeframe and Reliance Industries has subsequently underperformed but is slowly catching up.
The study of correlations can add the third dimension to your stock analysis. You can develop great intraday trading strategies or even a strong conviction on the stock markets over the long term.

Hide/Show Symbols – You can choose to keep the symbol navigation or hide it as per your convenience. As you can see above the screenshot on the right has a bigger display of the Nifty chart.

Studies/Technical analysis tools – Upon clicking on the “S” button as shown in the image above, you can get access to all the drawing tools, Fibonacci levels and other features that can be used to conduct technical analysis of stocks professionally.
The list of tools include:
• Types of charts (Line, HLC, OHLC and candlestick charts)
• Resistance and Support Levels
• Drawing tools
• Fibonacci Levels (Retracements, Arcs & Time zones)
• Gann Lines
• Quad lines
• Raff Regression etc.