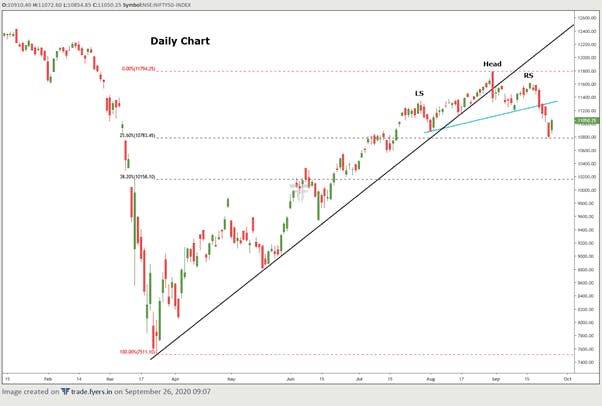
Since bottoming out in March, Nifty entered a steady uptrend, making a sequence of higher highs and higher lows, during which time it almost recovered from most of its early year plunge. The index steadily traded above a rising trend line connecting the lows of March and May.
However, the first sign of trouble emerged on the last trading session of August. On this day, the index formed a tall, bearish candle whose body engulfed the bodies of the past six candles. More importantly, on this day, the index closed below the rising trend line for the first time during this entire rally from March. For most of September, the index has remained under stress. In fact, for the first time since March, the index has made a sequence of lower high and lower low, signaling at a change in trend from up to down.
Going forward, as the index has precisely bounced off the 23.6% fibonacci retracement (of the rally from 7511 to 11794), the last week’s low of 10790 now becomes a critical level to keep an eye on. If that low breaks, we could see the selling extending towards 10570, which would be the minimum price objective of the bearish H&S pattern whose neckline was broken last week, followed by 10158, which would be the 38.2% retracement (of 7511 to 11794). On the upside, the immediate resistance to keep an eye on is 11298, which is the low of 9th September and which roughly coincides with the neckline of the broken H&S pattern. A break above that resistance would turn the immediate bias to neutral.