Each trading day, with its 22,500 seconds spanning across market hours, holds vast potential, but traders need the right tools to tap into it. Traditional charting tools often miss the intricacies of market movements, presenting a challenge for traders who rely on the utmost precision to capitalize on fleeting opportunities. This is particularly true for scalpers and options traders, for whom the ability to interpret price action quickly is essential.
Recognizing this gap, FYERS is set to transform the trading experience with the introduction of Seconds timeframe charts on Fyers App, Web, and API platforms. This innovative addition offers a unparalleled granularity with intervals of 5, 10, 15, 30, and 45 seconds, and providing candle history for up to 30 days—a first in the Indian brokerage industry.

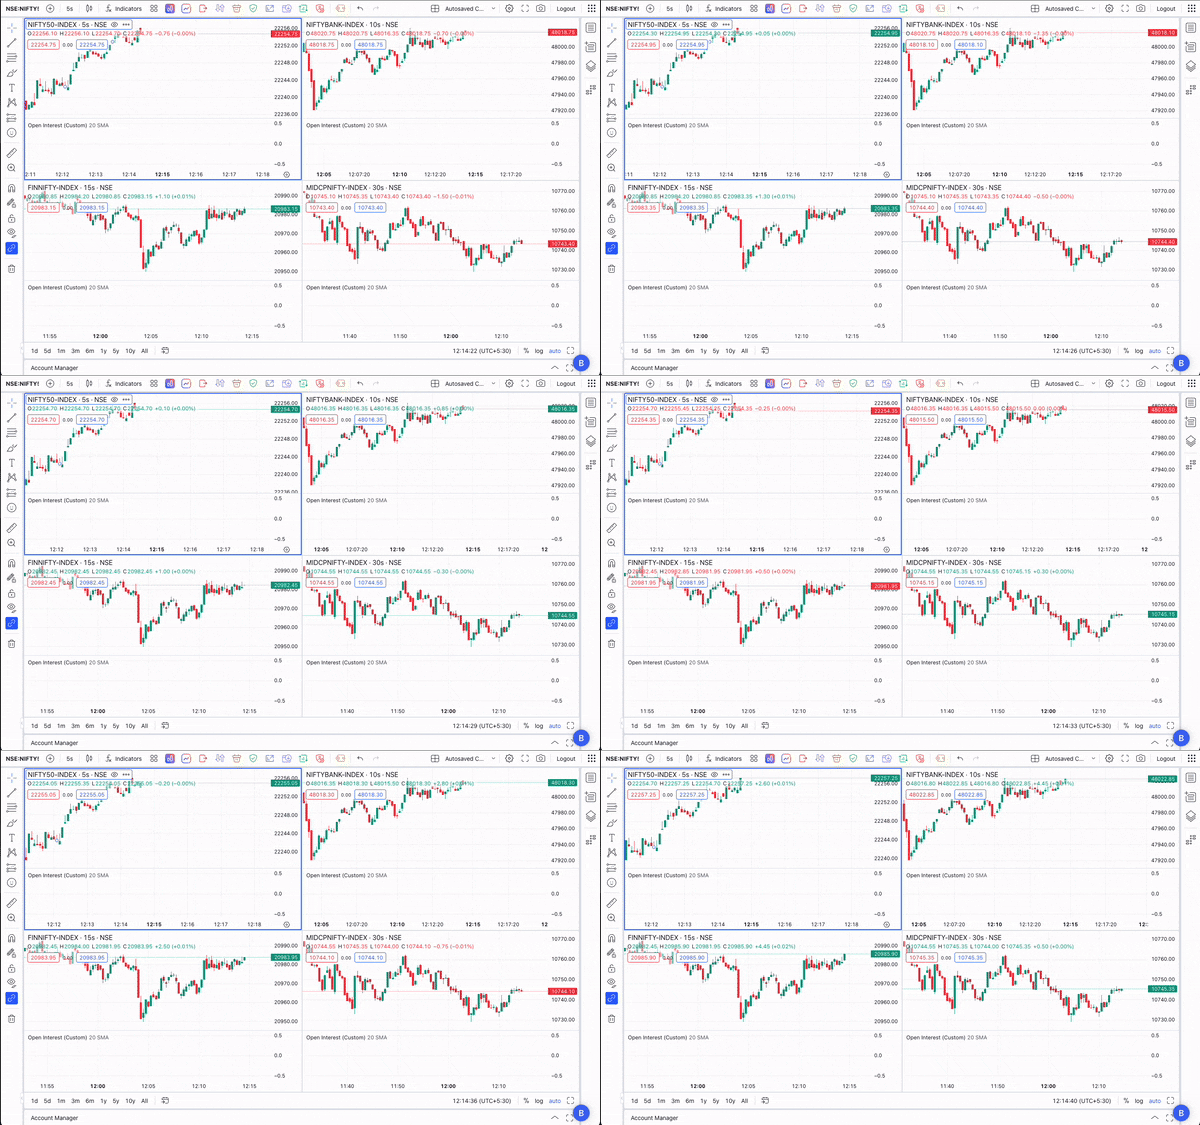
“A GIF showcasing the different types of seconds timeframe charts collated together, demonstrating the depth and versatility of the new feature.”
Why Seconds Charts? Unveiling the Benefits for Traders
The introduction of seconds charts on the FYERS platform brings forth a multitude of advantages tailored to meet the needs of modern traders:
Quick Scalping: With the ability to capture very short-term price movements, traders can now execute trades with an unprecedented level of precision. This is particularly beneficial for day traders and scalpers who thrive on capturing small, quick profits from the market.
Intraday Insights: Delving into seconds timeframe charts allows for a deeper understanding of intraday price fluctuations, unveiling patterns and trends that are not visible on longer timeframes. This enhanced insight can significantly improve trading strategies and outcomes.
Improved Risk Management: Access to more granular data enables traders to set tighter stop-loss orders and adjust position sizes based on rapid price changes, thereby enhancing their risk management strategies.
Comprehensive Historical Analysis: The combination of granular second-by-second data with a comprehensive 30-day history provides traders with a powerful tool for deep market analysis, strategy refinement, and risk assessment, further empowering them to make informed, data-driven decisions in the fast-paced trading environment.
Real-Life Impact: Examples of Benefits in Action
Consider the case of a scalper who relies on minute fluctuations in stock prices to make profits. With access to 5 and 10-second charts, they can more accurately time their entry and exit points, capitalizing on small price movements that others might overlook.
Options traders, on the other hand, can use 15 and 30-second charts to understand better the short-term sentiment and implied volatility of the markets, allowing for more informed decisions on options positions.
Accessing Seconds Timeframes on FYERS: A Seamless Experience
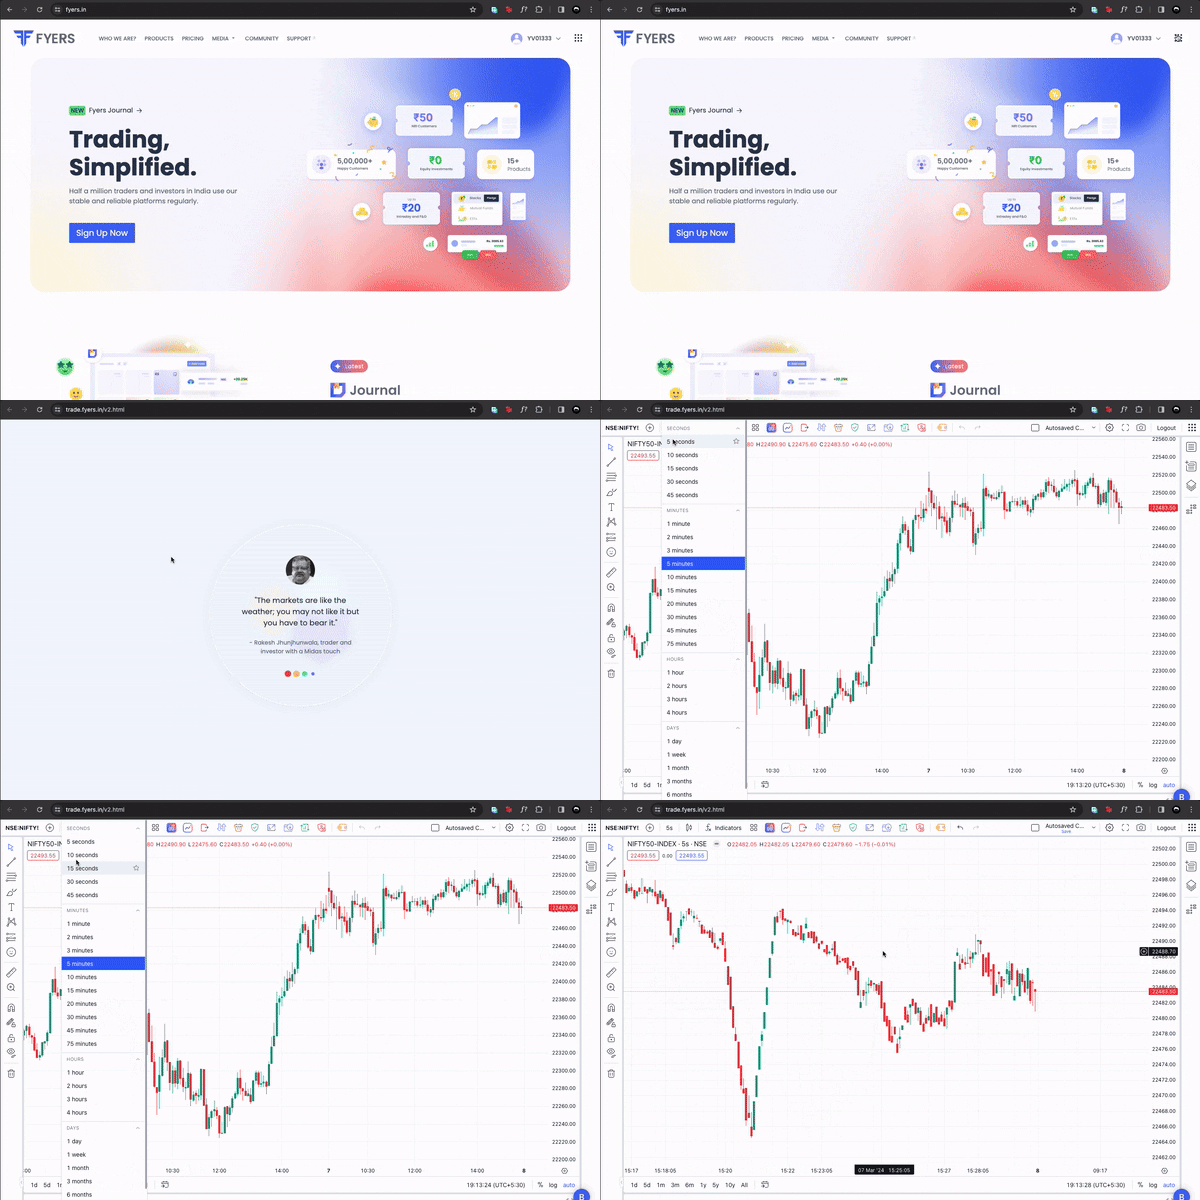
FYERS is committed to not only providing innovative features but also ensuring they are easily accessible. To access the new seconds timeframes, you need to click on the time frame drop-down menu at the top of the charts on the FYERS platform.
Check out the GIF below for a better understanding:

Conclusion
With the launch of Seconds timeframe charts, we have successfully bridged the gap between opportunity and action in the blink of an eye. By providing unparalleled access to granular market data, we empower traders to make informed decisions faster than ever before. The introduction of seconds charts is a testament to our commitment of making #TradingSimplified, ensuring that our users are equipped with the tools they need to navigate the markets with confidence.
Join us in embracing the future of trading by opening an account with FYERS. Experience how our cutting-edge features can enhance your trading strategy. If you find our platform elevates your trading journey, spread the word to friends and family. Together, let's redefine what's possible in the trading world.


